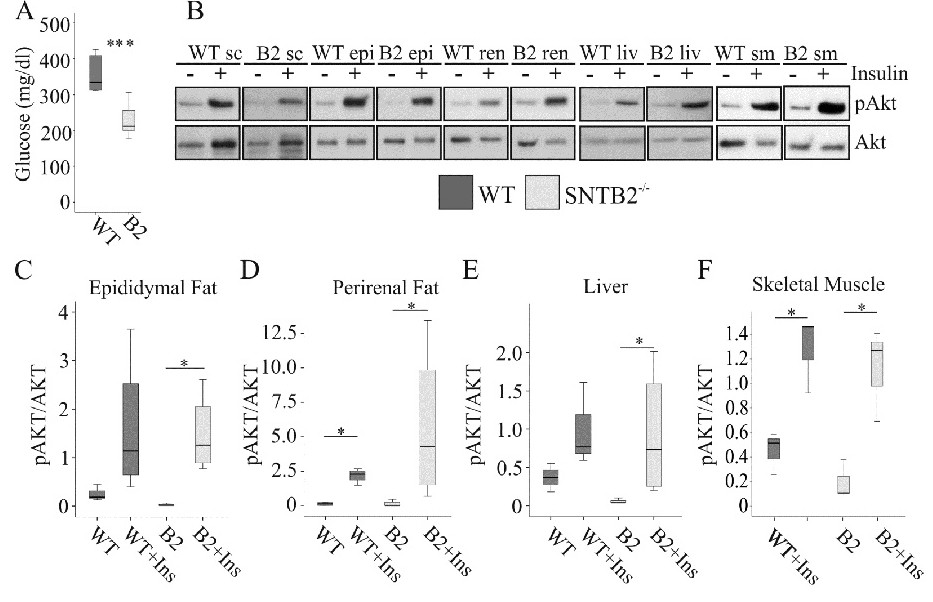
Fig. 4. Reduced fasting glucose and normal insulin response of SNTB2-/- animals. A. Fasting serum glucose of wild type and SNTB2-/- mice. B. pAkt and Akt 10 min after intraperitoneal H2O (-) or insulin (+) injection. Black borders correspond to where the image has been cropped. Quantification of pAkt / Akt in C. epididymal fat, D. perirenal fat, E, the liver and F, skeletal muscle (n = 3 - 4). Subcutaneous, sc; epididymal, epi; perirenal, ren; liver, liv; skeletal muscle, sm. * p<0.05, *** p<0.001.